What makes a good non-work project? I think it is the opportunity to learn new things and to have fun while doing it. If I can measure my performance on that thing, that’s a bonus; otherwise I will always fall into the trap of thinking it was great or crap, nothing in-between.
With that in mind I came across a Kaggle competition with the goal of analyzing x-rays of scrolls found at the Mt. Vesuvius eruption site and identifying the Greek letters written on them. The reason the data from the scrolls are from x-rays is that they are unable to be unrolled for visual inspection without significant damage.
The problem is basically a computer vision one, at least to start, which is something I have zero hands-on experience with. Combine that with the fact that it is reading scrolls from the Vesuvius eruption and the project checks the box for learning something new and on a fun topic. The performance of the output can also be measured against others since it is a Kaggle competition, and others’ notebooks are available after the competition closes to see how they approach the problem.
The organizers of the competition were good enough to share an example notebook so let’s start there and see what we can learn. There is more detail below on exactly the individual steps and the summary is:
- The image data of a single target is read in and displayed in the notebook for the user to visualize
- The image is also transformed into a tensor for modeling with PyTorch
- The single image is split into training and test data, modeled, and the model is then tested on the portion of the image excluded from training
Quickly stepping through the import statements the different packages are:
- torch (PyTorch) – a package focused on tensor calculation and deep learning
- NumPy – A core package for most developers used to manipulate and perform calculations on data
- Glob – used for finding files or paths
- Pil (Pillow) – A package used for image handling / manipulation
- Matplotlib – Used for graphing / visualization of data
- tqdm – Adds a progress bar on for loops so you can monitor for issues with speed, or like me, have trust issues
- ipywidgets – Lets you add html-based interaction to Jupyter notebooks
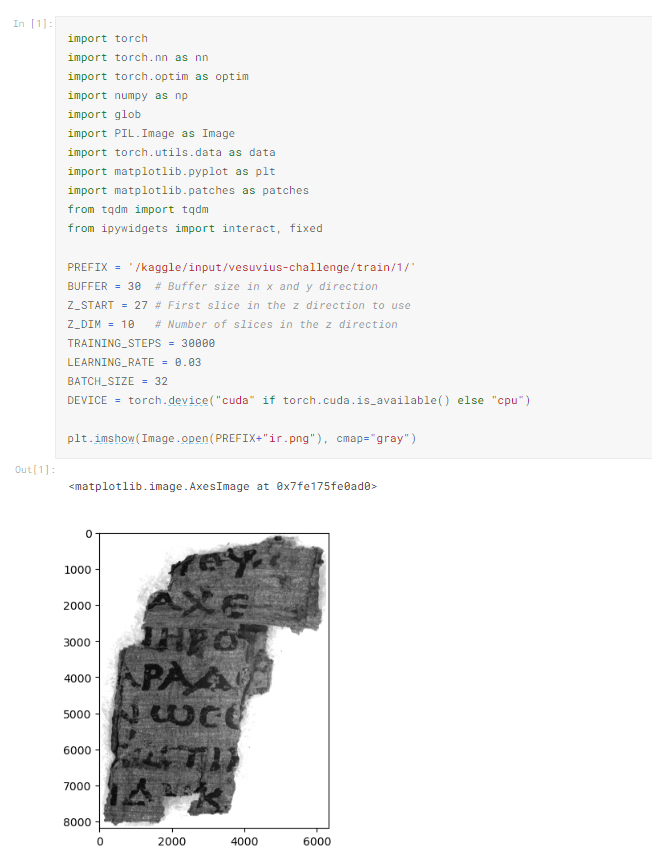
The next block of code declares a bunch of variables for use further in the program. Finally, the Image class from Pillow is used to open an example infrared image (the ‘ir’ trailer on the file name) and matplotlib prints it to the display.
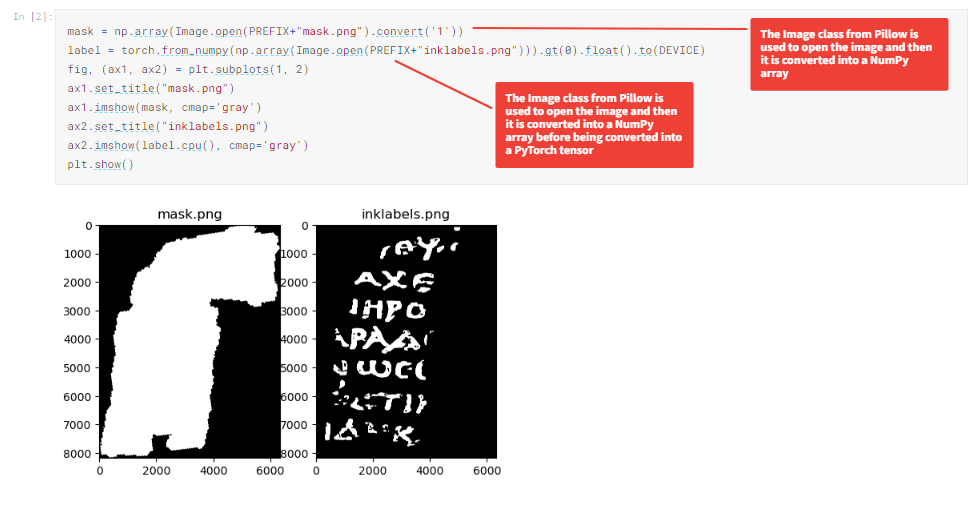
The code below displays a mask, which highlights the area of the image which is of interest as well as the areas where ink is known to be. The known inked areas act the same way as labels or outcomes do on other datasets.
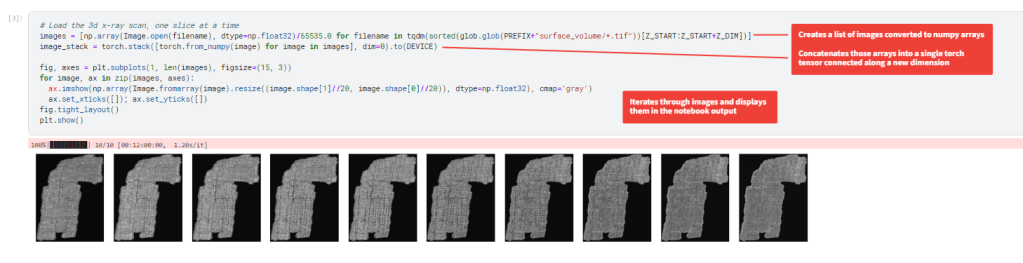
The next block of code is also part of the exploratory analysis of the data and loads the different layers of the x-ray scan and displays them. If you have any questions on how an image is expressed as an array this video from Rob Mulla starting at 4:20 through 9:38 is a good intro.
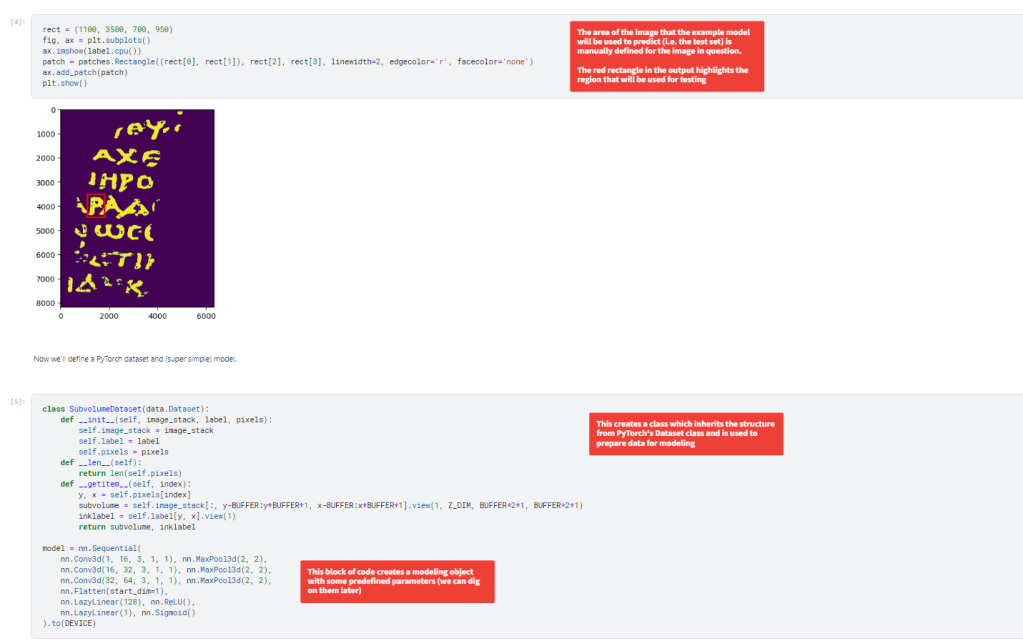
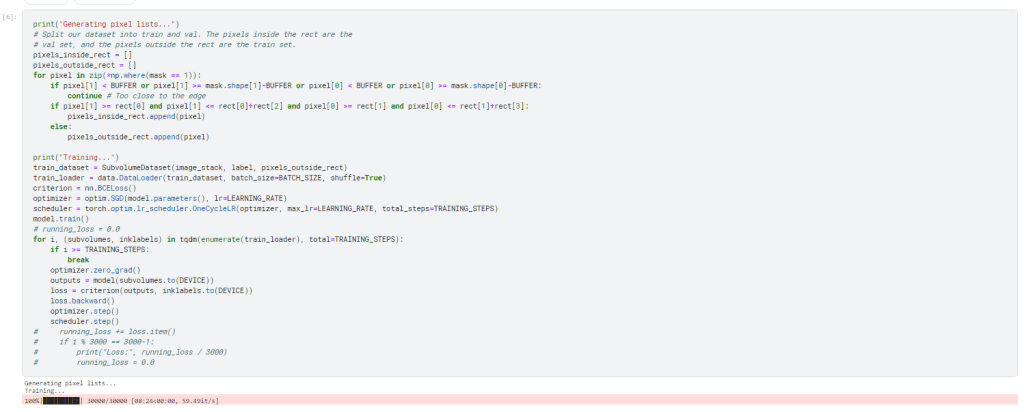
The next set of code defines a region of the image that is going to act as the training set (the portion outside of the rectangle) to create a model to detect the ink on the inside of the rectangle. The second cell creates a class for handling the data to be modeled and creates an instance of the PyTorch neural net with some predefined parameters. We will dig into those parameters more later when developing new models.
The model is trained using one the area outside of the rectangle from before using the model object with predefine parameters.
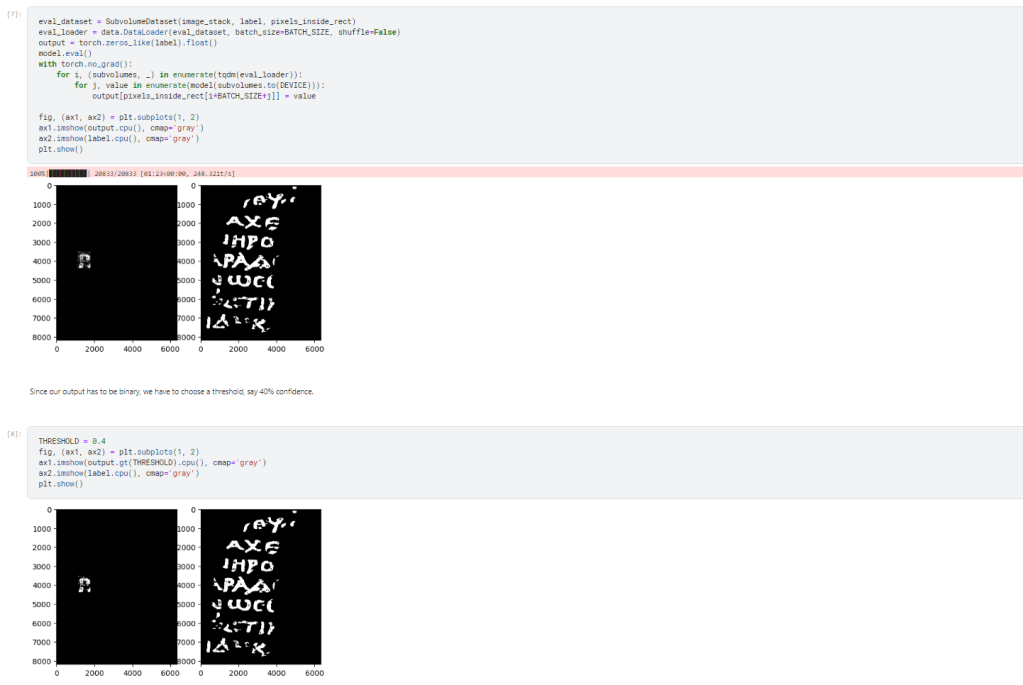
Finally, the model applied to the area inside the rectangle and as you can see it does a decent job at identifying the P.
Next Steps
- Expand data being considered by the model to all training data
- Exploratory data analysis
- Model training data with predefined / default parameters to establish an accuracy baseline
